Lately, we often hear that the Ovals are the new Rounds. Let’s look at the data to see if it supports this. We will be mostly analyzing ovals in 1ct, 1.5ct, 2ct and 3ct size groups.
First, let’s look at the price dynamics. Since June 1st, we can see healthy growth in 1.5ct and 2ct categories – 6.5% and 7.2% respectively. The 3-caraters also show a clear upward trend, with 4% growth from the beginning of the summer.
There has also been a moderate increase in the 1 carat diamond prices with the average pricing of 1ct Ovals remaining steady at overall growth of ~1.6%.

Fig. 1 – Price trends for Ovals (1ct, 1.5ct, 2ct, 3ct)
What is the market share of Ovals out of the total polished diamond market? Ovals represent the 5th most popular shape on the market after Rounds, Cushion Modified, Pears and Emeralds.
The overall market share fluctuates around 6.5% and shows a downward trend since the beginning of the summer which means that Ovals are becoming scarce on the market.
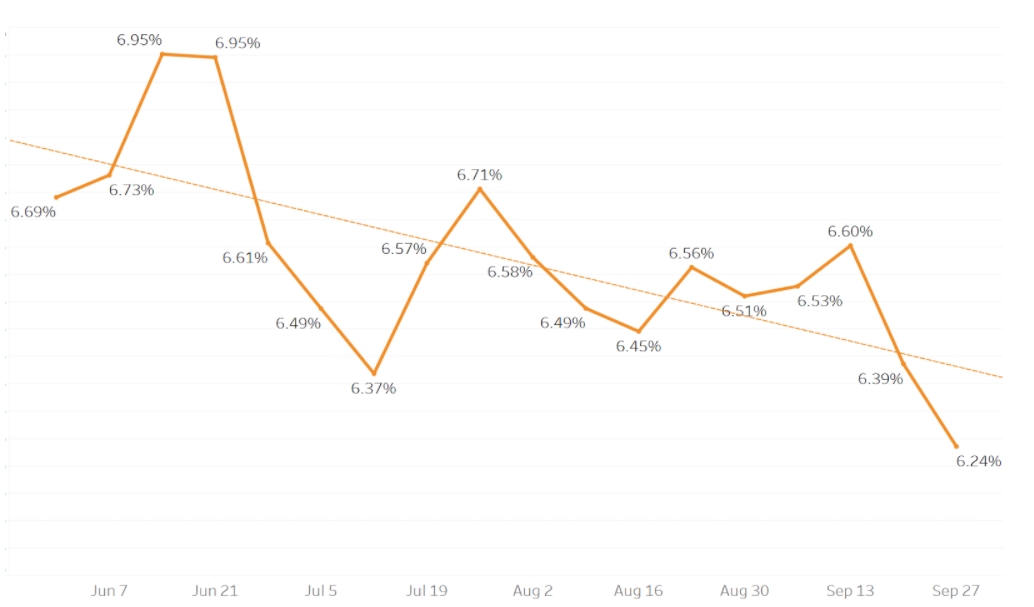
Fig. 2: Ovals as percentage of total market inventory, all sizes
It appears that over the summer Ovals have become somewhat more scarce on the market.
If we look at the UNI Scarcity Index® heatmap for the past month, we will indeed see that Ovals demonstrate high scarcity in most color and clarity combinations. In the graph below we show using color the areas where Oval diamonds have outstripped demand. The more dark red a category is, the more it is in demand, lesser the volume and higher the price – this is what makes up the UNI Scarcity Index®.
Fig 3. UNI Scarcity Index for Ovals in 1ct, 1.5ct, 2ct and 3ct, broken down by Color and Clarity

To better understand the Ovals inventory, it may be interesting to look at the breakdown of Ovals inventory by color and clarity, and compare it to Rounds.
We can immediately see that while the clarity breakdown is similar between the two shapes, the color breakdown is very different. Ovals inventory is much richer on higher colors: D, E and F combined represent almost 50% of Ovals, and only 35% of Rounds

Fig. 4: Inventory Breakdown by Color for 1ct, 1.5ct, 2ct and 3ct Ovals and Rounds

Fig. 5: Inventory Breakdown by Clarity for 1ct, 1.5ct, 2ct and 3ct Ovals and Rounds
One more vital metric we are all interested in is the average time to sell a stone. We are currently in the process of developing an extensive research around this metric at UNI and as more data arises here, we will share it with you. In the quarterly chart for Q2, the average time it took to sell an Oval stone, when the diamond came to be within the average price range was around 18 days. In Q3 that parameter dropped significantly to 12.2 days, getting much closer to the average number for Rounds.

Fig. 6: Average number of days to sell a stone for Ovals and Rounds
To summarize, we can conclude that we are witnessing a growing demand for Oval diamonds, and increased scarcity of Ovals on the market. So are ovals becoming the new rounds? They certainly are gaining traction and demand for them is increasing, which is a good thing for those who have the ability to transform some of their longer crystals into beautiful ovals. At the right market price, their sales into the market certainly has improved as has their appeal by retailers/consumers.
****
Want to get access to our Data Platform or do a custom research? Contact us at data@uni.diamonds
Disclaimer: The information in this report is based on UNI’s data repository that contains actual pricing and availability from over 90 manufacturers and wholesalers around the globe, with combined value of over $1.3B. The information is provided as-is, without any warranties express or implied